
As we start to see the high yield market gain some footing, it is important to note the improved market technicals, mainly fund flows and primary market issuance. For the week ending March 16th, we saw high yield retail funds take in another $1.7bil, making it the fifth consecutive week of inflows.1

Over that five weeks we have seen $11.2bil enter the asset class. This well reverses the negative inflows that we had seen through the first six weeks of the year, now putting us at a positive $6.1bil in inflows for the year. This is a significant reversal, given that for all of 2015, we saw $7.1bil leave the asset class.2 Clearly, money is starting to return to the asset class, which in turn has contributed to the price and return recovery we have seen over the last six weeks. Given what we see as attractive yields still being offered by the asset class, we could well see this trend of inflows continuing.
Another positive indicator is on the new issuance front, where dollar volume in the past week has increased to a 17-month high.3
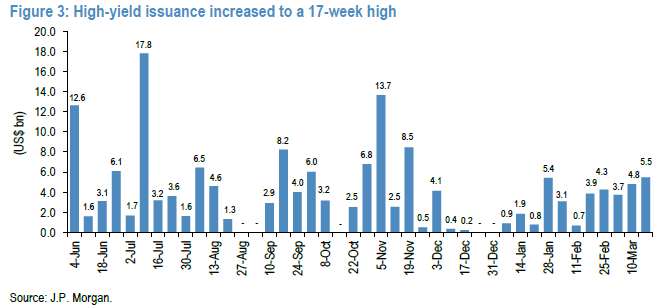
Again, we’d see this as a positive signal that interest is starting the re-emerge in the space and companies are able to undertake issuance for things like refinancing and M&A activity, though notably issuance so far has been focused on higher quality issuers, which we would expect to see before the market opens up to lower quality issuers.
Finally, there is one market technical investors, especially in index-based products, should be aware of. This is fallen angels—previously investment grade companies that have been downgrade by the ratings agencies to high yield. So far in 2016, we’ve seen a huge number of fallen angels.4
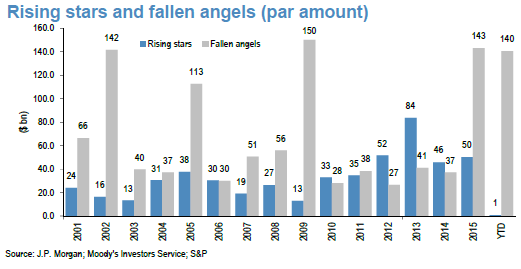
We are looking at $140bil in fallen angels in less than three months, versus $143mm seen in all of 2015. This also clearly puts us on pace for the highest level of fallen angel volume that we have seen in the past 15 years, likely surpassing the $150bil in volume that we saw in 2009. While a high level of fallen angel volume does increase the size of the high yield market, here we believe it is important to note the breakdown of what is being downgraded and added to high yield.
The vast majority of these downgrades are in the energy space, with metals and mining making up virtually all of the non-energy downgrades (with just a few selective downgrades in other sectors). Energy currently makes up about 12.8% of the J.P. Morgan US High Yield Index and metals and mining 3.8%,5 but this will likely materially increase over the coming months as these fallen angels enter the index (of note, the fallen angels hit the index in about 90 days following the downgrade6). While we believe oil prices have likely hit their bottom back in February, we aren’t convinced that the volatility is over and remain skeptical that many companies will survive at current prices; thus, we caution investors to be very selective in their energy allocations. While there may be some selective opportunities in the space, we certainly do not believe it is time for a broad allocation to the sector and index-based investors should be aware that their allocation may well be increasing as these fallen angels hit.
As we look at the high yield market technicals, we believe that the increased retail fund flows and increased new issuance volume are positive indicators that interest is starting to re-emerge for the space as investors take advantage of what we see as largely an under-valued market, offering what we view as attractive yield. However, we continue to believe that investors should be taking advantage of the space via active management, focusing on credit selection. We believe this becomes even more relevant as we’ll see energy, metals, and mining make up more of the indexes due to the fallen angels hitting the market and indexes over the next few months.