
According to the EIA, U.S. crude oil imports averaged about 7.3 million barrels per day last week with Canadian barrels making up 3.2 million barrels of the total.1 U.S. commercial reserves increased by 1.9 million barrels week over week where total inventories fell 3.7 million barrels2 versus expectations of a build of 950,000.3 Are we at the beginnings of a rebalancing of the market? Possibly. New well permits across the top three fields in the U.S. have reportedly fallen off dramatically in November, and given the dynamics of shale production, this may quickly impair U.S. production growth forecasts.
It’s no secret that oil’s plummet from above $100/bbl to current levels has hit the North American oil industry hard. Both stocks and bond prices of E&P (exploration and production) and service companies in Canada and the U.S. have dropped markedly over the last couple of months. That said, the medium-term impacts of this price decline will likely not be felt quite so equally across the North American or, indeed, the global market due to fundamental differences in business models, existing leverage and currency arbitrages that certain producers enjoy.
We have discussed the challenges we see with the shale oil business model many times, specifically that the exceptionally high decline rates and the production costs lead to an expensive treadmill that we believe many of these companies can never get off of. Declines in U.S. shale are as high as 90-95% in the first two years.4 A sustainable production model in our view is not one that requires a company to race like mad to punch more holes in the ground just to maintain existing production. That said, we acknowledge that there is definitely money to be made in tight oil and we like these plays at the project level, where payouts are quick and the wells are financed with the right term of debt (short-term, commensurate with the life of the project). But we do not support them as businesses that we can lend money to over the long term due to excessive capex requirements that lead to chronic negative free cash flow.
Numerous theories exist about why the Saudis elected not to cut production at the November 27th meeting. Ours quite simply is that the rapidly growing U.S. shale production in recent years, coupled with the return of missing barrels from the likes of Iraq and Libya, threw the market out of whack and resulted in a crude oversupply. The production adds from these regions have had the follow on consequence of creating an increasingly competitive market in Asia, where the Saudis have the vast majority of their market share. In an effort to protect market share and rebalance the market, the Kingdom has taken very deliberate action to target high cost shale producers at the margin who have used leverage to finance their operations. Do we think that the Russians, the rest of OPEC and the majors around the globe are involved in this? Yes we do.
The main opposition to this concept comes from the other main conspiracy theory that is floating around these days that is centered on Russia and goes like this: the Saudis and the U.S. are in collusion to punish Putin for his actions in the Ukraine. The Saudis support the U.S. in this because the quid pro quo here is that the Saudi’s get U.S. support in Middle East affairs, where ISIS is running amuck, and the U.S. gets to teach Putin a lesson. It’s not a bad theory, it just fails to recognize some economic realities that we have long known and have been exploiting, such as the currency differentials impacting the actual realized prices in various geographies.
The fate of resource based economies like Canada rest in the strength of commodity prices. The Canadian dollar tends to rise and fall with oil as a result of this. As a consequence, Canadian producers have been partially insulated by the decline in the price of oil because of the fact they sell oil in US dollars (USD) but incur costs in Canadian dollars (CAD). Thus at a USD/CAD exchange of $1.135, which is where it approximately stands today, a Canadian producer is realizing a price of C$75.52 on WTI of $67.43 (in US$).6
Russia is also highly dependent on oil revenues for its economy. Much has been written and said about Russia’s need of $100 oil to balance its budget. Indeed, recent reports peg the impact of oil’s price decline as costing Russia about $100 billion per year. However, like Canada’s loonie, the ruble has devalued to the dollar along with the fall in the price of oil. The chart below represents the ruble’s decline over recent months in relation to the USD.7
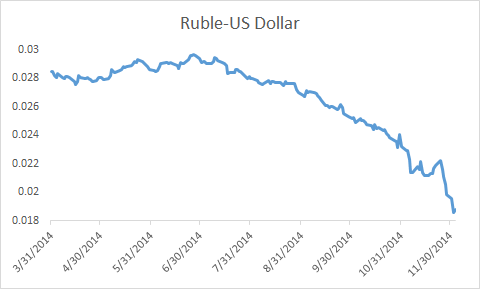
When one considers the impact of the price decline on regional Russian crudes such as the East Siberian Pacific Ocean oil8, when coupled with the currency arbitrage of a falling ruble, it is clear the Russians aren’t the intended victim in this Saudi murder mystery. In fact, at the quoted exchange rates and a price of $69.32 for this type of crude at the time of writing, Russian producers are actually realizing a ruble price today that is only 4.5-5% less than what they were receiving in early June of this year.9 Yes, over the longer term a falling ruble will have far wider reaching impacts on the Russian economy and purchasing power, but one still has to ask the question of whether it is logical to think that making the whole world suffer just to show Putin he can’t misbehave is realistic?
Marginal production out of high cost sources like shale are clearly the easiest and most logical target of the Kingdom’s recent decision not to cut production. By killing off some of the shale production it’s a win for nearly everyone but the U.S. Eventually, we’d expect formerly displaced light oil imports will return to the U.S. and market share competition in places such as Asia will ease up.
At Peritus we have long been of the opinion that many shale producer business models are flawed and unsustainable, and now that oil has fallen so precipitously, cracks in already stretched balance sheets are starting to appear. Energy represents 18% of the U.S. high yield market.10 Capital expenditures commonly exceeded cash flows of many shale producers at $100/bbl. How do you think they will they fare at $70 with wells that decline by 90-95% every two years?
While calm waters are a ways off for the oil markets and along the way there will undoubtedly continue to be unexpected supply disruptions out of the Middle East and Africa that will add volatility to prices, we expect the medium to longer term supply and demand dynamics will lead to a rebound in oil prices, benefiting those that are able to withstand these shorter-term price dynamics.