
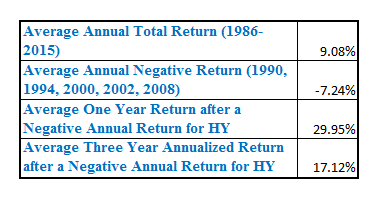
The high yield bond market was down 4.6% for 2015, making this only the sixth time we have seen the market post a negative calendar year return in its nearly thirty years of existence and the third worst year on record.1
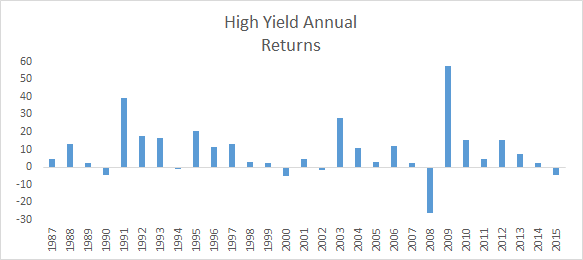
Notably, we’ve never had two negative years in a row. Not only that, it is important to keep in mind that the negative years have generally been followed by strong years of performance.2
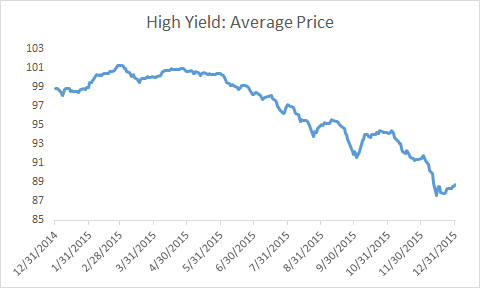
As we look back on 2015, the actual carnage in the high yield market was far worse than a -4.6% decline would indicate. As money flowed out of the market and there were a lack of buyers, we saw prices gap down, in some cases 10-20 points at a time, as reflected by the decline in average price for the index going from a high of $101.33 in February to a low of $87.82 in December.3
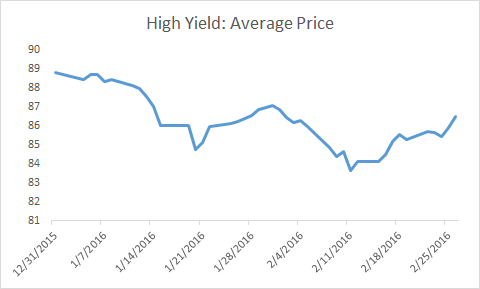
As 2016 has ensued, the pressure on the high yield market continued for the first six weeks, as financial markets around the world turned negative. However, over the last couple weeks, high yield has seemed to find a footing and we have started to see pricing stabilize and improve.4
These gaps down in prices have created big discounts in many cases. As value investors, we are always on the lookout for price declines for wrong, temporary, and/or non-fundamental reasons. Bonds have built in call and maturity dates, so pricing gaps often cure themselves over time for the companies that can continue to pay their bills (including interest costs). We saw this in spades in the late 2008/early 2009 period when bond prices fell off a cliff in many companies out of fear in the market, even though profits and cash flows, while down a from what they were prior to the recession, were still more than ample for the company to service their debts and continue capital spending activity as needed.
As we sit today, we believe we are in the midst of one of the most compelling opportunities for active high yield investors since that 2009 time-period. Debt of fundamentally solid, cash flow generating companies now trades at big price discounts and large yields. With the world slowing, we will undoubtedly see this hit sales and possibly profits of a number of companies, but not enough to materially alter the fundamentals and the ability to service debt in many cases.
We do see this as one of the most compelling opportunities to purchase high yield in years, but that doesn’t mean investors should buy indiscriminately. The reality is a notable portion of the high yield market is directly tied to oil and commodities. Yes oil may well have found its bottom and could be stabilizing from here. That has helped investor psychology, but this stable level is in the $30s, which is certainly not a sustainable price for many producers and service providers. We are seeing the energy related bankruptcies start to hit, with some larger high yield issuers going that route in the last couple weeks, including the $3.5bil in debt from Sandridge Energy and nearly $3bil in debt from Energy XXI.5 We are even seeing some companies preemptively default, even when they have cash to continue for now but taking advantage of the market environment to clean up their balance sheet.
So with the attractive opportunity for investment also comes danger. Investing is rarely simple, nor do returns come easy. We’ve always believed that investing involves doing your homework on each credit and actively managing your portfolio. While indexing may work well during the boom times when it is a one way trade up, there are times in the cycle when indexing does not afford the flexibility to sell or avoid certain credits, such as we believe is necessary to navigate through the current environment. It isn’t the time to indiscriminately hold the high yield asset class, yet we see great opportunities for active investors who have flexibility in what they put or don’t put in a portfolio, can focus on fundamentals, and can look for the notable value we currently see in terms of price discounts and/or attractive yields.