
We’ve written about this topic before but feel it is worth revising given some of the rhetoric we hear by the financial pundits today as they discuss “risky” securities. Some seem to classify high yield bonds as “risky” but don’t seem to account for the risk inherent in equity investing as well. As we have discussed before, we believe there are a few important factors to consider when evaluating “risk” in high yield bonds versus equities.
Ratings
High yield bonds are classified as such by their ratings. The rating agencies assign investment grade versus non-investment grade (high yield) bond ratings based on their determination of credit quality. While we are skeptical of the ratings process given some of the limitations and backward looking nature of the process (see our piece “The Ratings Game = Opportunity“), there is no denying that this process is fundamental as to how we define the high yield market. Given the higher perceived risk of non-investment grade bonds versus investment grade bonds, these bonds generally carry higher yields to compensate the investor. But in looking at ratings, some seem to believe high yield bonds are too risky given the lower ratings, and then turn to equities instead. However, that sort of thinking doesn’t consider the fact that these bonds are in fact rated, while equities are not. So if you are considering ratings as you look at various investments, how are you to say a rated bond is more risky than an unrated equity?
Capital Structure
Along those lines, it is also important to understand where bonds and equities fall in a company’s capital structure. Debt (bonds and loans) ranks ahead of equities in the event of a default or bankruptcy. This means that within a company, they would pay their debt back first before there would be any meaningful recovery for equity holders. Defaults are a certainly a consideration, but in looking at specific company, if it were to default, the company’s bonds would fare considerably better than the equity the vast majority of the time.
Dividends/Interest
Income is an important component in high yield investing, as these bonds produce regular income via the coupon/interest rate on the bonds. Equities may produce income via dividends, but companies are not required to declare dividends. A company is contractually obligated to pay the coupon on their bonds per the bond indenture. On the flip side, a dividend on the equity is based on the discretion of the company’s board so a company can choose to not pay a dividend at all, or choose to cut or eliminate it at any point without violating any legal or contractual obligation to their stakeholders. Thus, income via bond interest payments is much steadier than dividend income.
Volatility
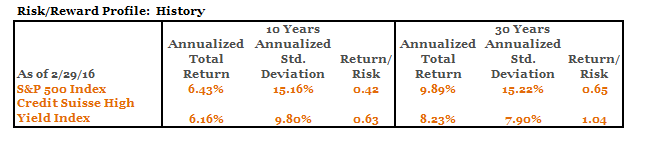
Finally, risk is often measured in terms of volatility (i.e., volatility of returns). Much has been made recently of the volatility in the high yield market. As we have noted, we have always seen periods of increased volatility in the high yield market when we see sell pressure, and that is currently be intensified some by the post financial crisis regulations that have limited market making activity by investment banks (see our piece “Understanding Market Liquidity”). However, in looking at the returns and volatility (as measured by the standard deviation of returns) over history, high yield bonds have historically performed relatively similarly to equities, but with nearly half the risk as measured by the volatility of returns.1
Even if you were to just look at that the past year, a period during which so many market commentators in the media seemed to focus on volatility within high yield, we saw similar results.2
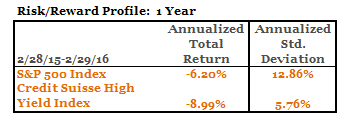
Again, over this period, during which we saw the high yield market lead the way in declining in response to the reality of the slow growth environment, we saw equities have more than twice the volatility of high yield bonds.
We’ve recently written about some of our concerns for the equity market from a valuation perspective and the challenges we feel this market faces going forward, as we believe the high yield market has already downwardly adjusted, and in our opinion over-corrected, in response to weakening market dynamics, while we believe the equity market has more room to fall (see our pieces “The Equity Alternative” and “High Yield vs. Equities—Is this the End of the Run for Equities”). We believe it is also important that investors frame the concept of “risk” in the proper light as they consider investing in high yield bonds and/or equities. Keep in mind that nearly two-thirds of high yield issuers in the Credit Suisse High Yield Index referenced above have public equity.3 Historically high yield bonds have outperformed equities (as measured by the S&P 500) on a risk adjusted basis (the return/risk metric in the chart above), helped by the consistent coupon/income generation and lower volatility.